

Pie Chart Maker
Pie Chart Maker is an online pie chart generator that turns pasted spreadsheet data into clean, labeled pie charts with percentages, donut and 3D options, and exports to PNG or SVG for slides and reports, all without creating an account.
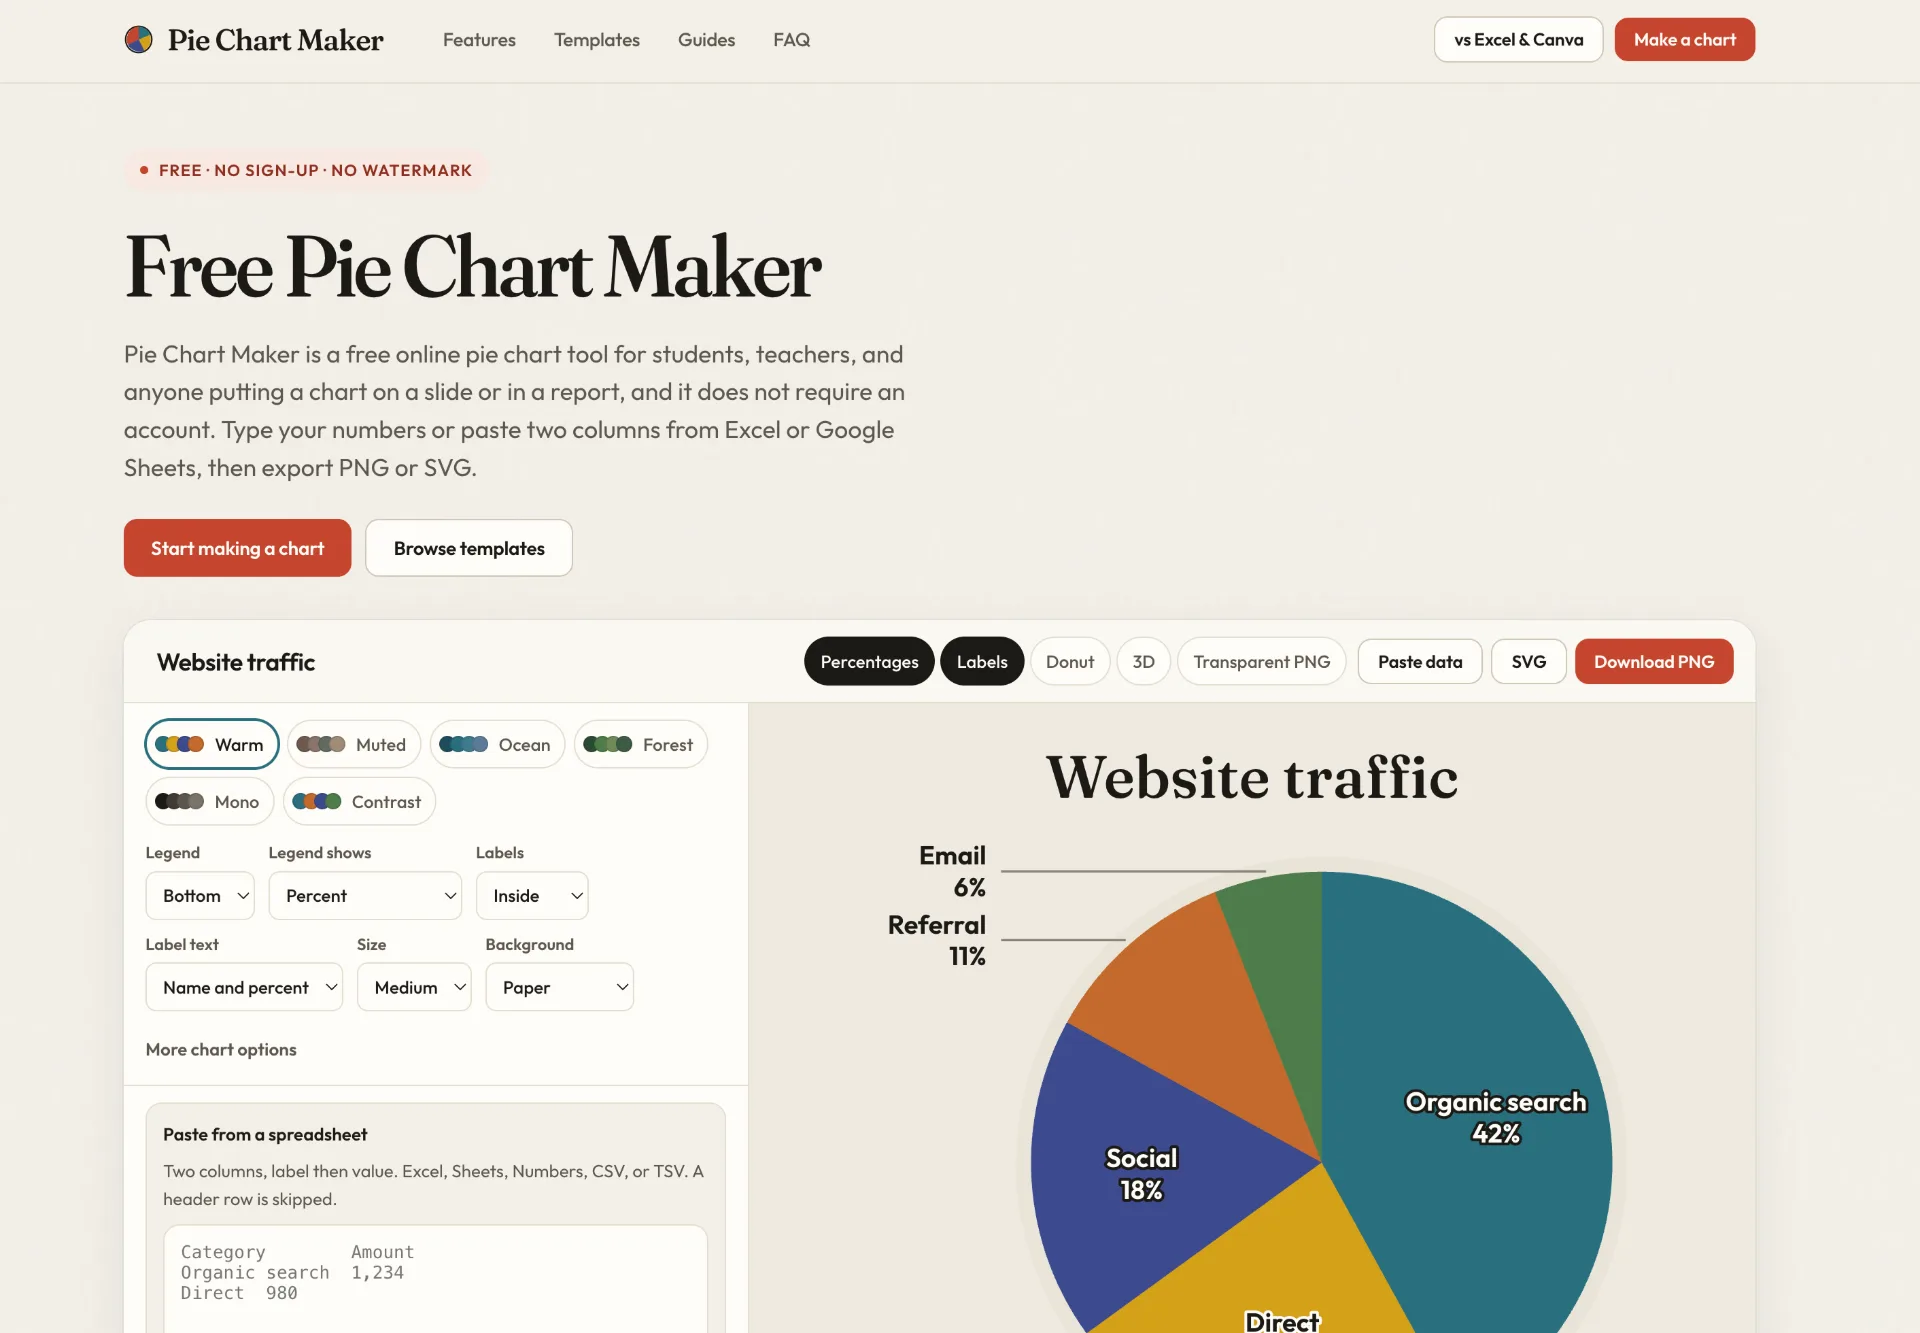
What is Pie Chart Maker
Pie Chart Maker is an online pie chart generator that lets you turn simple label-and-value data into a clean, presentation-ready pie chart. It runs entirely in your browser, calculates each slice’s percentage automatically, and offers options like donut style, 3D tilt, legend positioning, and multiple color themes. You can paste data directly from Excel or Google Sheets and then export the finished chart as a PNG or SVG for use in Google Slides, Docs, Canva, and other tools.
How to use Pie Chart Maker
-
Open the Pie Chart Maker editor
Visit the Pie Chart Maker page and open the main editor. You will see a default example pie chart and a data table with slices and values. -
Enter or paste your data
Replace the sample data in the slice table with your own categories and numbers.- To type data manually, click into each label and value cell and edit them.
- To paste from Excel, Google Sheets, Numbers, CSV, or TSV, copy two columns (label first, then value), then choose “Paste data” or paste directly into the rows. The tool reads tab-, comma-, or semicolon‑separated text, and will skip a header row when the second cell is not a number.
-
Check percentages and total
As you type or paste values, Pie Chart Maker automatically calculates each share of the total and displays percentages on the slices by default. Your numbers do not have to add up to 100; the tool treats the sum of the values as the whole and derives the percentages from that total. -
Adjust labels, legend, and text
Configure how labels appear on the chart:- Choose whether label text appears inside or outside the slices.
- Decide whether to show the legend on the right, at the bottom, or hide it.
- Pick whether labels display the name, the percentage, the value, or a combination (such as “value and percent”).
You can also add a chart title and an optional subtitle or source line for your report or slide.
-
Customize colors and style
Select a built‑in color theme such as Warm, Muted, Ocean, Forest, Mono, or Contrast, or recolor individual slices for your brand or classroom example.- Turn on the donut option if you prefer a ring‑style chart.
- Enable the 3D toggle to tilt the chart and give it a thicker edge for slides that ask for a 3D look.
- Adjust the slice gap and starting angle to fine‑tune spacing and rotation.
- Choose the background between paper, white, or transparent, and change text size (small, medium, or large).
-
Refine the slices
Use the controls under the data table to manage your categories:- Add a new slice with “Add slice” when you need another category.
- Use “Clear all” to remove all rows and start from a blank chart.
- Load an example template (such as Website traffic, Survey results, Quarterly budget, Market share, or Favorite fruit) and then swap in your numbers.
-
Export your chart
When the chart looks the way you want:- Click to download a PNG image for reliable use in Google Slides, Docs, and similar tools. You can export with a transparent background if the slide is not cream; PNGs are rendered at twice the on‑screen size for sharpness.
- Or download an SVG file when you want a scalable graphic that stays crisp in Canva, design tools, and vector editors.
-
Insert into your document or slide deck
Open your destination tool and insert the exported file:- In Google Slides, choose Insert → Image and upload the PNG.
- In Canva or other design software, upload the PNG or SVG and position it on your layout.
The chart behaves like a regular image that you can resize and arrange on the page.
Pie Chart Maker's use case
-
Business reports and presentations
Create labeled pie charts that clearly show market share, channel mix, or budget allocation and drop them straight into slide decks and PDFs. -
Marketing and website analytics
Visualize website traffic sources or campaign performance by turning channel metrics into a chart tailored for stakeholders who prefer a quick snapshot of proportions. -
Classroom teaching and homework
Explain circle graphs and fractions using fruit votes, survey responses, or class data, without needing students to learn full spreadsheet chart workflows. -
Survey summaries and research snapshots
Turn survey answer distributions into easy‑to‑read figures for articles, internal memos, and summary dashboards where you only need a single static chart. -
Design and publishing workflows
Generate clean pie graphics in SVG or transparent PNG, then place them into Canva, print layouts, or infographics as part of a more complex visual design.
Benefits of Pie Chart Maker
-
Direct from data to chart without complex tools
By focusing on one specific job—making a pie chart—Pie Chart Maker avoids the overhead of full spreadsheet or design software. You can paste two columns, adjust the look, and export, all in a single focused interface. -
Seamless integration with Excel, Sheets, and other sources
The tool accepts copied label‑and‑value columns from Excel, Google Sheets, and other tabular sources. You do not have to upload a workbook, configure a chart wizard, or keep a live link; it simply reads your pasted text and builds the chart. -
Automatic percentage calculation and labeling
Percentages are enabled by default and update instantly as you edit values. You do not need to pre‑compute shares or worry about totals summing to 100; the chart always reflects the relative size of each slice based on your numbers. -
Flexible styling for slides and documents
With multiple color themes, label positions, legends, donut mode, and an optional 3D tilt, it is straightforward to match the chart to an existing deck, classroom worksheet, or brand‑neutral report layout. -
Privacy‑friendly and browser‑based workflow
The rows are handled in your browser rather than being uploaded as a stored dataset. You can refresh and keep working, clear the chart when you are done, and export the image files you need without creating an account or tying the chart to a remote document.
Pros
- Focused interface built specifically for pie charts, with percentages on by default.
- Easy paste‑in workflow from Excel, Google Sheets, CSV, and TSV without file uploads.
- Multiple export options (PNG, transparent PNG, SVG) suitable for slides, documents, and design tools.
- Includes donut and 3D modes, legend controls, and color themes for quick visual customization.
- Works entirely in the browser and does not require any account creation.
Cons
- Limited to pie and circle‑style charts; it does not cover other chart types like line or area charts.
- Static exports mean charts do not stay live‑linked to their original spreadsheet data.
- Styling options are intentionally simpler than full design suites, so highly customized brand layouts still require external tools.
- 3D mode is a visual approximation only and may sacrifice some clarity compared with flat charts.
- No built‑in collaboration or version history as you might find in full office suites.
Help more people discover your product.
Submit to Submito